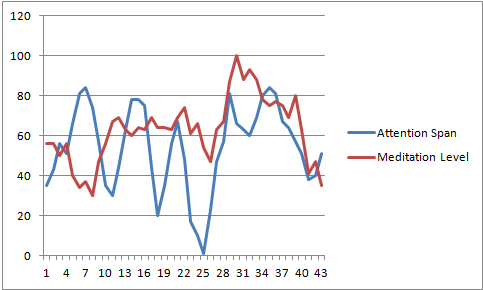
The time has come to assess whether or not I am a suitable pilot for the project. After collecting some results involving concentratiing for a little while and meditating a little while, I gathered these preliminary results and put them into graph form. The results were as follows
The first is myself
This is my willing test subject
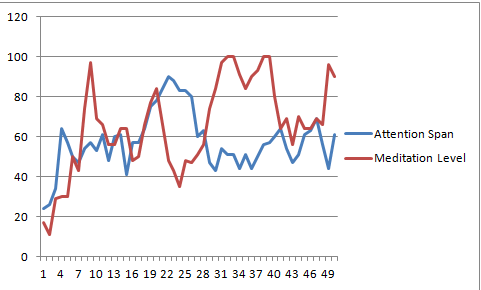
The results are pretty inconclusive and it’s been decided that I will spend 3 minutes meditating and 3 concentrating, and do the same with my test subject (to see how I compare)
The main aspect that was offputting at first was the idea that I have to type all of this data into the cells manually.
After some further research into the matter I discovered that you can import data from notepad straight into excel. The problem is that the format of my text file is not suitable as is, it displays as follows
Meditation value: 43 and the time is 18:25:18
Attention Span: 54 and the time is 18:25:19
Meditation value: 74 and the time is 18:25:19
Attention Span: 57 and the time is 18:25:20
Meditation value: 97 and the time is 18:25:20
Attention Span: 53 and the time is 18:25:21
Meditation value: 69 and the time is 18:25:21
and excel reads the descending values into one column which I do not want. A rewrite of my code should fix this so it displays as
Meditation value: 43 while Attention Span: 54 and the time is 18:25:18
so that I can read them straight in. I am also looking to use openGL to make c++ render my results in real time into a linegraph, but this is proving a difficult task.
More to follow